Short Answer
Toy sales: The following graph presents the percent market share for the US Toy Retail Sales between brick and mortar toy sales and online sales for the years 2011-2015. Does the graph present an accurate picture of the differences in revenue from these two sources? Or is it misleading?
Explain. 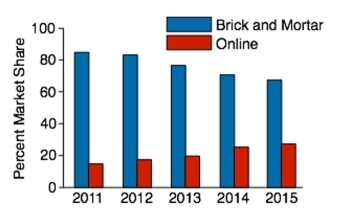
Correct Answer:

Verified
Correct Answer:
Verified
Q12: The amounts 3 and 2 are compared.
Q13: Thirty households were surveyed for the
Q14: The following frequency distribution presents the
Q15: A sample of 200 high school
Q16: Construct a stem-and-leaf plot for the
Q18: A sample of 200 high school
Q19: The following frequency distribution presents the
Q20: The following pie chart presents the percentages
Q21: The following frequency distribution presents the
Q22: The following table presents the purchase