Multiple Choice
Following are the numbers of Dean's List students in a random sample of 20 university courses. Construct a dotplot for these data.
A) 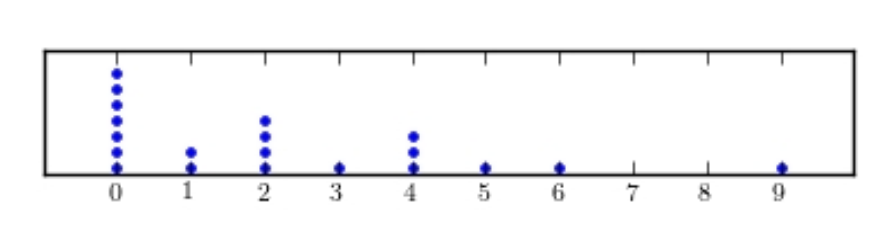
B) 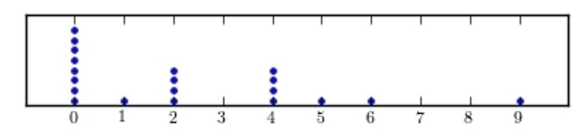
C) 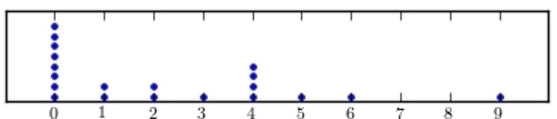
D) 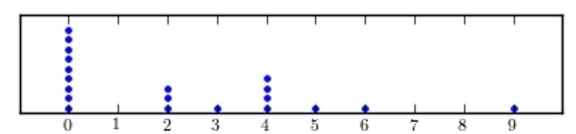
Correct Answer:

Verified
Correct Answer:
Verified
Related Questions
Q26: Construct a stem-and-leaf plot for the
Q27: The following frequency distribution presents the
Q28: The amounts 3 and 4 are compared.
Q29: The following pie chart presents the percentages
Q30: The following time-series plot presents the population
Q32: Construct a dotplot for the following
Q33: Chocolate or vanilla: The following bar graph
Q34: The following frequency distribution presents the
Q35: The following table presents the purchase
Q36: The following table presents the purchase