Multiple Choice
The amounts 3 and 4 are compared. Which of the following graphical displays are the least misleading?
A) 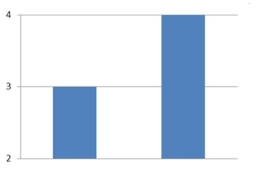
B) 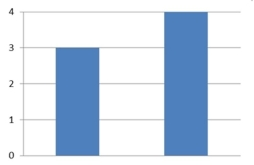
C) 
D) 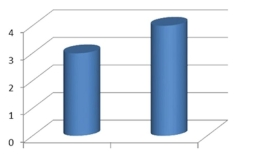
Correct Answer:

Verified
Correct Answer:
Verified
Related Questions
Q23: Helium prices: The cost of grade A
Q24: Classify the histogram as unimodal or bimodal.
Q25: Thirty households were surveyed for the
Q26: Construct a stem-and-leaf plot for the
Q27: The following frequency distribution presents the
Q29: The following pie chart presents the percentages
Q30: The following time-series plot presents the population
Q31: Following are the numbers of Dean's
Q32: Construct a dotplot for the following
Q33: Chocolate or vanilla: The following bar graph