Multiple Choice
The following time-series plot presents the population growth (in percent) of a suburb of Atlanta, Georgia for each of the years 1990 through 2009. Estimate the amount by which the rate of growth
Changed from 1,995 to 2,004. 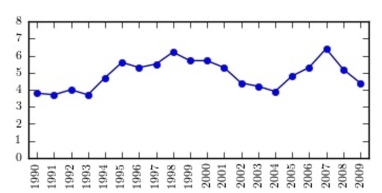
A) about -1.3 percentage points
B) about -2.9 percentage points
C) about -1.0 percentage points
D) about -1.9 percentage points
Correct Answer:

Verified
Correct Answer:
Verified
Q25: Thirty households were surveyed for the
Q26: Construct a stem-and-leaf plot for the
Q27: The following frequency distribution presents the
Q28: The amounts 3 and 4 are compared.
Q29: The following pie chart presents the percentages
Q31: Following are the numbers of Dean's
Q32: Construct a dotplot for the following
Q33: Chocolate or vanilla: The following bar graph
Q34: The following frequency distribution presents the
Q35: The following table presents the purchase