Multiple Choice
Which of these choices display the correct scatterplot?
A) 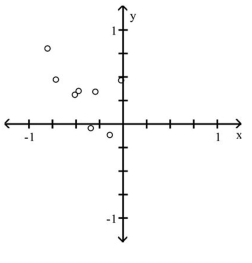
B) 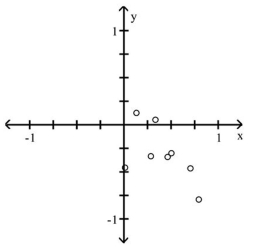
C) 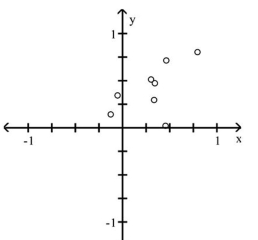
D) 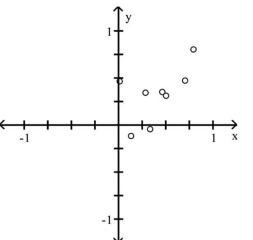
Correct Answer:

Verified
Correct Answer:
Verified
Related Questions
Q9: Consider the frequency distribution below, which
Q10: The frequency distribution below summarizes the
Q11: Construct a pie chart representing the given
Q12: Analysis of the data from 25
Q13: The following data set represents Heather's
Q15: Construct a pie chart representing the
Q16: The frequency distribution for the weekly
Q17: Use the high closing values of
Q18: In a survey, 26 voters were
Q19: The histogram below represents the number of