Multiple Choice
Construct a pie chart representing the given data set.
-The following data give the distribution of the types of houses in a town containing 40,000 houses. 
A) 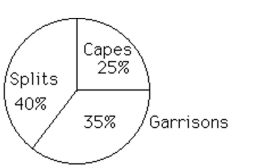
B) 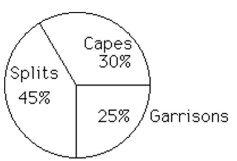
Correct Answer:

Verified
Correct Answer:
Verified
Related Questions
Q10: The frequency distribution below summarizes the
Q11: Construct a pie chart representing the given
Q12: Analysis of the data from 25
Q13: The following data set represents Heather's
Q14: <span class="ql-formula" data-value="\begin{array} { r r r
Q16: The frequency distribution for the weekly
Q17: Use the high closing values of
Q18: In a survey, 26 voters were
Q19: The histogram below represents the number of
Q20: <span class="ql-formula" data-value="\begin{array}{c|c}\text { Speed } &