Multiple Choice
A nurse measured the blood pressure of each person who visited her clinic. Following is a relative-frequency histogram for the systolic blood pressure readings for those people aged between 25 and 40. The blood pressure
Readings were given to the nearest whole number. Approximately what percentage of the people aged 25-40
Had a systolic blood pressure reading between 110 and 119 inclusive? 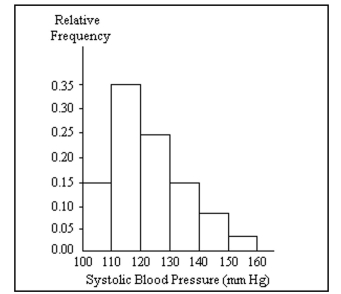
A) 3.5%
B) 30%
C) 0.35%
D) 35%
Correct Answer:

Verified
Correct Answer:
Verified
Q38: Solve the problem.<br>-Construct a frequency distribution and
Q122: Use the high closing values of
Q123: The frequency table below shows the
Q124: Construct a pie chart representing the
Q125: Use the data to create a
Q126: Identify the cumulative frequency distribution that
Q127: The following data represent the number
Q129: Construct a pie chart representing the given
Q130: Construct one table that includes relative frequencies
Q131: The two key parts of a regression