menu-iconExamlexExamLexServices

Discover

Ask a Question
  1. All Topics
  2. Topic
    Statistics
  3. Study Set
    Basic Business Statistics
  4. Exam
    Exam 2: Organizing and Visualizing Data
  5. Question
    Given Below Is the Scatter Plot of the Number of Employees
Solved

Given Below Is the Scatter Plot of the Number of Employees

Question 48

Question 48

True/False

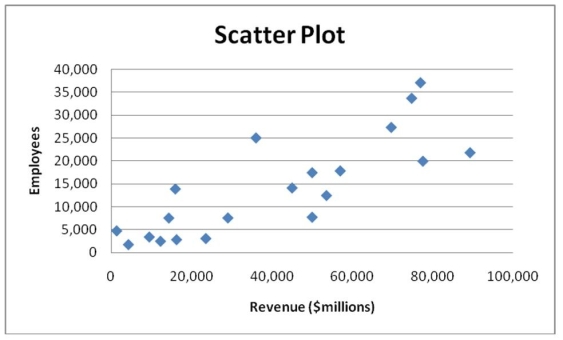
Given below is the scatter plot of the number of employees and the total revenue ($millions) of 20 U.S. companies. There appears to be a positive relationship between total revenue and the number of employees.

Correct Answer:

verifed

Verified

Unlock this answer now
Get Access to more Verified Answers free of charge

Related Questions

Q33: In general,a frequency distribution should have at

Q43: TABLE 2-9<br>The frequency distribution below represents the

Q44: TABLE 2-8<br>The Stem-and-Leaf display represents the number

Q45: TABLE 2-17<br>The following table presents total retail

Q47: TABLE 2-15<br>The figure below is the ogive

Q49: TABLE 2-10<br>The histogram below represents scores achieved

Q50: TABLE 2-13<br>Given below is the stem-and-leaf display

Q51: TABLE 2-13<br>Given below is the stem-and-leaf display

Q104: When constructing charts,the following is plotted at

Q145: The larger the number of observations in

Examlex

ExamLex

About UsContact UsPerks CenterHomeschoolingTest Prep

Work With Us

Campus RepresentativeInfluencers

Links

FaqPricingChrome Extension

Download The App

Get App StoreGet Google Play

Policies

Privacy PolicyTerms of ServiceHonor CodeCommunity Guidelines

Scan To Download

qr-code

Copyright © (2025) ExamLex LLC.

Privacy PolicyTerms Of ServiceHonor CodeCommunity Guidelines