True/False
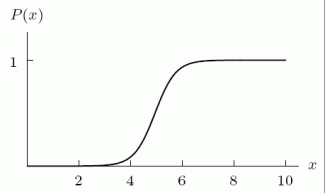
The cumulative distribution function in the second graph corresponds to the density function in the first graph. 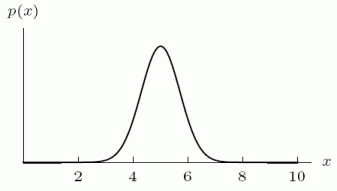
Correct Answer:

Verified
Correct Answer:
Verified
Related Questions
Q53: The following figure gives the density function
Q54: Which of the following functions makes the
Q55: The cumulative distribution function for the time
Q56: The following figure shows the distribution of
Q57: The probability of waiting no more than
Q59: Suppose <img src="https://d2lvgg3v3hfg70.cloudfront.net/TB8190/.jpg" alt="Suppose is
Q60: The following figure shows a density function
Q61: A banana plant typically has about 40
Q62: The density function and the cumulative distribution
Q63: The following figure shows a density function