menu-iconExamlexExamLexServices

Discover

Ask a Question
  1. All Topics
  2. Topic
    Mathematics
  3. Study Set
    Applied Calculus
  4. Exam
    Exam 7: Probability
  5. Question
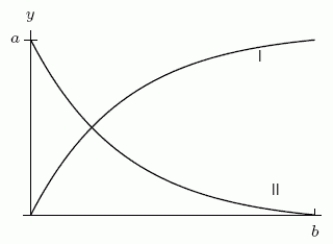
    The Following Figure Shows a Density Function and the Corresponding
Solved

The Following Figure Shows a Density Function and the Corresponding

Question 60

Question 60

Short Answer

The following figure shows a density function and the corresponding distribution function. Which curve represents the cumulative distribution function? The following figure shows a density function and the corresponding distribution function. Which curve represents the cumulative distribution function?
Correct Answer:

verifed

Verified

Unlock this answer now
Get Access to more Verified Answers free of charge

Related Questions

Q55: The cumulative distribution function for the time

Q56: The following figure shows the distribution of

Q57: The probability of waiting no more than

Q58: The cumulative distribution function in the second

Q59: Suppose <img src="https://d2lvgg3v3hfg70.cloudfront.net/TB8190/.jpg" alt="Suppose is

Q61: A banana plant typically has about 40

Q62: The density function and the cumulative distribution

Q63: The following figure shows a density function

Q64: The following figure shows a density function

Q65: Suppose that the distribution of people's ages

Examlex

ExamLex

About UsContact UsPerks CenterHomeschoolingTest Prep

Work With Us

Campus RepresentativeInfluencers

Links

FaqPricingChrome Extension

Download The App

Get App StoreGet Google Play

Policies

Privacy PolicyTerms of ServiceHonor CodeCommunity Guidelines

Scan To Download

qr-code

Copyright © (2025) ExamLex LLC.

Privacy PolicyTerms Of ServiceHonor CodeCommunity Guidelines