Short Answer
The density function and the cumulative distribution function for the ages of people in an elementary school are graphed below. Which figure is the cumulative distribution function?
I. 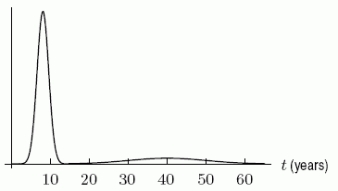 II.
II. 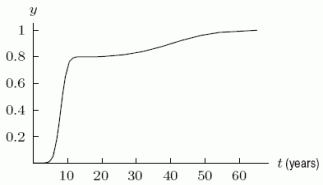
Correct Answer:

Verified
Correct Answer:
Verified
Related Questions
Q57: The probability of waiting no more than
Q58: The cumulative distribution function in the second
Q59: Suppose <img src="https://d2lvgg3v3hfg70.cloudfront.net/TB8190/.jpg" alt="Suppose is
Q60: The following figure shows a density function
Q61: A banana plant typically has about 40
Q63: The following figure shows a density function
Q64: The following figure shows a density function
Q65: Suppose that the distribution of people's ages
Q66: The density function for the shelf life,
Q67: A density function is given by <img