Multiple Choice
The density function for the shelf life, in days, of a product in a grocery store is shown in the graph. 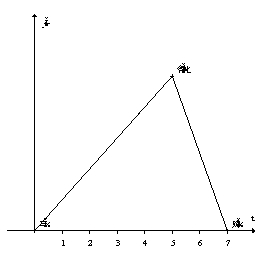 Estimate the median shelf life of the product.
A) 2.25 days
B) 3.25 days
C) 4.25 days
D) 5.25 days
Correct Answer:

Verified
Correct Answer:
Verified
Q58: The cumulative distribution function in the second
Q59: Suppose <img src="https://d2lvgg3v3hfg70.cloudfront.net/TB8190/.jpg" alt="Suppose is
Q60: The following figure shows a density function
Q61: A banana plant typically has about 40
Q62: The density function and the cumulative distribution
Q63: The following figure shows a density function
Q64: The following figure shows a density function
Q65: Suppose that the distribution of people's ages
Q67: A density function is given by <img
Q68: A professor far away from here gives