Short Answer
Consider the following graph. In region III,  is ________ (positive/negative) and
  is ________ (positive/negative).
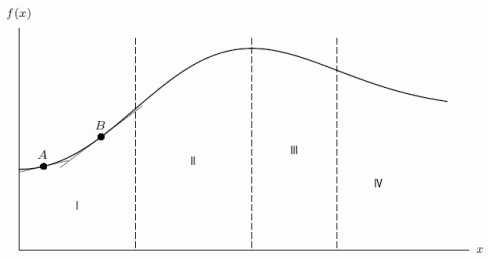
Correct Answer:

Verified
Part A: ne...View Answer
Unlock this answer now
Get Access to more Verified Answers free of charge
Correct Answer:
Verified
View Answer
Unlock this answer now
Get Access to more Verified Answers free of charge
Q122: The following table gives the cost and
Q123: Cost and revenue functions are graphed in
Q124: Estimate <img src="https://d2lvgg3v3hfg70.cloudfront.net/TB8190/.jpg" alt="Estimate when
Q125: An amount of $500 was invested in
Q126: Given the following data about the function
Q127: The graph below is the graph of
Q128: The growth graph in the following figure
Q130: The noise level, N, in decibels, of
Q131: Let <img src="https://d2lvgg3v3hfg70.cloudfront.net/TB8190/.jpg" alt="Let represent
Q132: Using a calculator, estimate the derivative of