Short Answer
The graph below shows the velocity of an object (in meters/second). Find an upper bound for the number of meters traveled from t = 1 to t = 5 seconds. 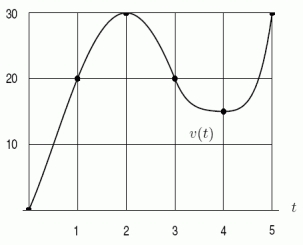
Correct Answer:

Verified
Correct Answer:
Verified
Related Questions
Q12: Use a calculator to evaluate <img src="https://d2lvgg3v3hfg70.cloudfront.net/TB8190/.jpg"
Q13: The following figure shows the graph of
Q14: Use the following figure to find the
Q15: If <img src="https://d2lvgg3v3hfg70.cloudfront.net/TB8190/.jpg" alt="If and
Q16: Consider a sports car which accelerates from
Q18: The marginal cost function of producing a
Q19: Consider the graph of the function <img
Q20: The following figure shows the rate of
Q21: Use the following figure to find the
Q22: Sales of a new product are increasing