Short Answer
Consider the graph of the function  shown in the following figure.
A. Approximate  by using a right-hand sum with 3 subdivisions. Round to 2 decimal places.
B. Is your answer to part (A) a lower or an upper estimate? 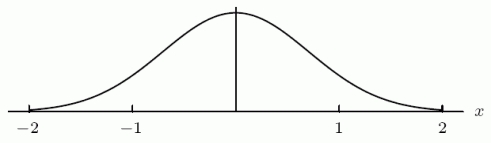
Correct Answer:

Verified
Part A: 0....View Answer
Unlock this answer now
Get Access to more Verified Answers free of charge
Correct Answer:
Verified
View Answer
Unlock this answer now
Get Access to more Verified Answers free of charge
Q14: Use the following figure to find the
Q15: If <img src="https://d2lvgg3v3hfg70.cloudfront.net/TB8190/.jpg" alt="If and
Q16: Consider a sports car which accelerates from
Q17: The graph below shows the velocity of
Q18: The marginal cost function of producing a
Q20: The following figure shows the rate of
Q21: Use the following figure to find the
Q22: Sales of a new product are increasing
Q23: Data for a function G is given
Q24: If a function is concave up, then