Multiple Choice
The following figure shows the graph of the velocity, v, of an object (in meters/sec) . If the graph were shifted up 4 units, how would the distance traveled between t = 0 and t = 6 change? 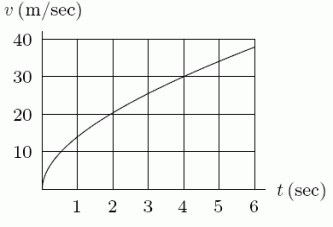
A) It would increase by 4 meters.
B) It would decrease by 4 meters.
C) It would increase by 24 meters.
D) It would decrease by 24 meters.
E) It would remain the same.
Correct Answer:

Verified
Correct Answer:
Verified
Q8: The following figure shows the rate of
Q9: The rate of pollution pouring into a
Q10: Suppose <img src="https://d2lvgg3v3hfg70.cloudfront.net/TB8190/.jpg" alt="Suppose is
Q11: Using the following figure, calculate the value
Q12: Use a calculator to evaluate <img src="https://d2lvgg3v3hfg70.cloudfront.net/TB8190/.jpg"
Q14: Use the following figure to find the
Q15: If <img src="https://d2lvgg3v3hfg70.cloudfront.net/TB8190/.jpg" alt="If and
Q16: Consider a sports car which accelerates from
Q17: The graph below shows the velocity of
Q18: The marginal cost function of producing a