Multiple Choice
The following figure shows the rate of change of enrollment for a community college. Estimate the total change in enrollment over the first 6 years. 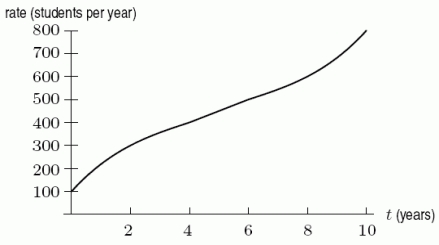
A) 1900 students
B) 2300 students
C) 2700 students
D) 2900 students
Correct Answer:

Verified
Correct Answer:
Verified
Related Questions
Q15: If <img src="https://d2lvgg3v3hfg70.cloudfront.net/TB8190/.jpg" alt="If and
Q16: Consider a sports car which accelerates from
Q17: The graph below shows the velocity of
Q18: The marginal cost function of producing a
Q19: Consider the graph of the function <img
Q21: Use the following figure to find the
Q22: Sales of a new product are increasing
Q23: Data for a function G is given
Q24: If a function is concave up, then
Q25: A reagent is cooling in a laboratory