Short Answer
Data for a function G is given in the following table. Estimate  (to 3 decimal places). Average upper and lower sums.
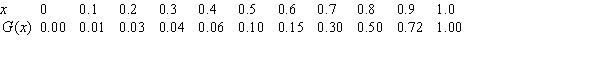
Correct Answer:

Verified
Correct Answer:
Verified
Related Questions
Q18: The marginal cost function of producing a
Q19: Consider the graph of the function <img
Q20: The following figure shows the rate of
Q21: Use the following figure to find the
Q22: Sales of a new product are increasing
Q24: If a function is concave up, then
Q25: A reagent is cooling in a laboratory
Q26: Use the following graph to estimate <img
Q27: Estimate the area above the curve <img
Q28: Below is a graph of the rate