menu-iconExamlexExamLexServices

Discover

Ask a Question
  1. All Topics
  2. Topic
    Statistics
  3. Study Set
    Basic Business Statistics
  4. Exam
    Exam 2: Organizing and Visualizing Data
  5. Question
    Given Below Is the Scatter Plot of the Market Value
Solved

Given Below Is the Scatter Plot of the Market Value

Question 73

Question 73

True/False

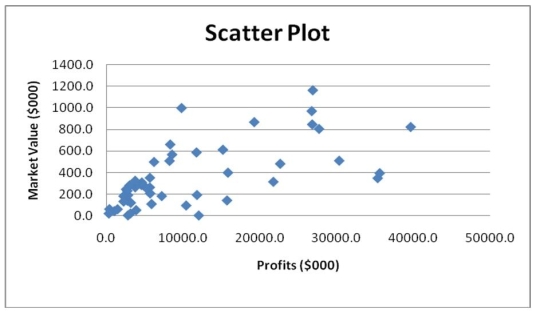
Given below is the scatter plot of the market value (thousands$)and profit (thousands$)of 50 U.S. companies. Higher market values appear to be associated with higher profits.

Correct Answer:

verifed

Verified

Unlock this answer now
Get Access to more Verified Answers free of charge

Related Questions

Q2: To determine the width of class interval,

Q20: You have collected data on the approximate

Q110: TABLE 2-3<br>Every spring semester, the School of

Q151: TABLE 2-4<br>A survey was conducted to determine

Q152: TABLE 2-10<br>The histogram below represents scores achieved

Q160: TABLE 2-6<br>A sample of 200 students at

Q167: TABLE 2-18<br>The stem-and-leaf display below shows the

Q168: TABLE 2-11<br>The ordered array below resulted from

Q171: TABLE 2-12<br>The table below contains the opinions

Q204: TABLE 2-8<br>The Stem-and-Leaf display represents the number

Examlex

ExamLex

About UsContact UsPerks CenterHomeschoolingTest Prep

Work With Us

Campus RepresentativeInfluencers

Links

FaqPricingChrome Extension

Download The App

Get App StoreGet Google Play

Policies

Privacy PolicyTerms of ServiceHonor CodeCommunity Guidelines

Scan To Download

qr-code

Copyright © (2025) ExamLex LLC.

Privacy PolicyTerms Of ServiceHonor CodeCommunity Guidelines