Multiple Choice
TABLE 17-1
A local newspaper has 10 delivery boys who each deliver the morning paper to 50 customers every day. The owner decides to record the number of papers delivered on time for a 10-day period for one of the delivery boys and construct a p chart to see whether the percentage is too erratic. 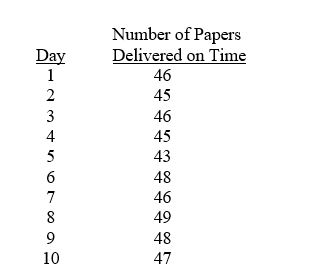
-Referring to Table 17-1, which expression best characterizes the p chart?
A) Cycles
B) Increasing trend
C) In-control
D) Individual outliers
Correct Answer:

Verified
Correct Answer:
Verified
Q36: The cause of variation that can be
Q55: The R chart is a control chart
Q56: TABLE 17-3<br>A quality control analyst for a
Q61: The Cp index measures the potential of
Q62: TABLE 17-8<br>Recently, a university switched to a
Q63: The CPL and CPU indexes are used
Q64: TABLE 17-9<br>The manufacturer of canned food constructed
Q65: Referring to Table 17-7, an <img src="https://d2lvgg3v3hfg70.cloudfront.net/TB1602/.jpg"
Q73: Common causes of variation represent variation due
Q139: Variation due to the inherent variability in