Multiple Choice
The double-broken-line graph shows the number of Calories per day that should be consumed by women and men in various age groups. Use the following graph. What is the difference between the number of Calories recommended for men and the number recommended for women 11 to 14 years of age? 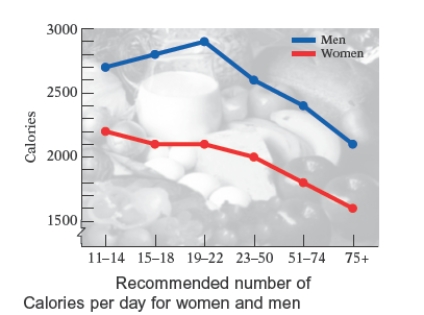
A) 600 Calories
B) 500 Calories
C) 400 Calories
D) 700 Calories
E) 300 Calories
Correct Answer:

Verified
Correct Answer:
Verified
Q47: The total cholesterol readings for 40 female
Q48: The heights, in inches, of the
Q49: The circle graph shows the number
Q50: The life expectancies, in years, in
Q51: The pictograph in the following figure gives
Q53: The total cholesterol readings for 40 female
Q54: The circle graph shows the number
Q55: The double-bar graph below shows the fuel
Q56: Most health statistics list normal body temperature
Q57: Each of the letters of the