Multiple Choice
RNA-seq and ribosome profiling experiments have been carried out on the same cells. The following simplified graphs show the results for the same genomic region containing a gene with three exons. Which graph (1 or 2) do you think corresponds to the RNA-seq results? What feature is represented by the arrow? 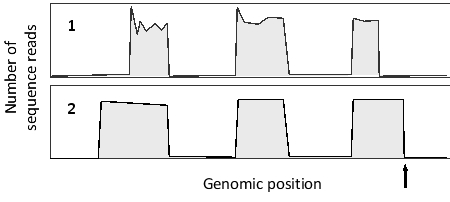
A) Graph 1; stop codon
B) Graph 1; polyadenylation site
C) Graph 2; stop codon
D) Graph 2; polyadenylation site
Correct Answer:

Verified
Correct Answer:
Verified
Q83: For a complementation test to work, the
Q84: The results of two sets of chromatin
Q85: A piece of DNA has been sequenced
Q86: Sort the following cellular components to reflect
Q87: In purifying proteins by column chromatography, elution
Q89: You have grown cultures of the yeast
Q90: In an unfolded (random coil) protein, amino
Q91: Some feed-forward motifs are capable of generating
Q92: There are six possible reading frames for
Q93: In the following schematic graph, the fraction