Short Answer
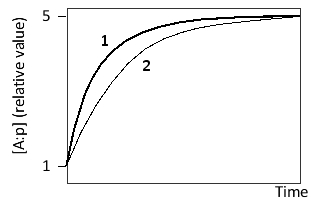
Consider a transcription regulatory protein (A) that can bind to a promoter (p). After reaching an initial steady state, the concentration of A is suddenly increased tenfold. The following graph shows the formation of A:p over time after this change for two systems, one of which is described by higher k?ff and k?n values compared to the other. Which curve (1 or 2) corresponds to this system? Write down 1 or 2 as your answer.
Correct Answer:

Verified
The system with higher k?ff a...View Answer
Unlock this answer now
Get Access to more Verified Answers free of charge
Correct Answer:
Verified
View Answer
Unlock this answer now
Get Access to more Verified Answers free of charge
Q39: How are antibody-producing hybridoma cell lines immortalized
Q40: In Sanger sequencing, does each labeled DNA
Q41: Indicate whether each of the following descriptions
Q42: You have isolated five mutations (1 to
Q43: Consider a promoter sequence with n binding
Q45: In sequence alignments such as those generated
Q46: Indicate whether ordinary agarose-gel electrophoresis (A), polyacrylamide-gel
Q47: You have used fluorescence-activated cell sorting to
Q48: If two genomic polymorphic sites were randomly
Q49: You have discovered a mutant protein that