Multiple Choice
The circle graph summarizes the results of a survey of the favorite movie category chosen by a group of adults. 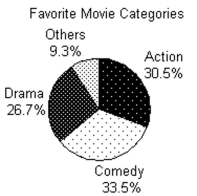
-2800 adults answer the survey. How many of the survey respondents said that they favor drama movies? Round to the nearest whole.
A) 2670 respondents
B) 748 respondents
C) 854 respondents
D) 260 respondents
Correct Answer:

Verified
Correct Answer:
Verified
Q53: The circle graph summarizes the results of
Q54: Suppose that the numbers 1 through
Q55: Use the information given to draw
Q56: The line graph shows the recorded hourly
Q57: The following pictograph shows the number of
Q59: A deck of cards contains 52
Q60: A deck of cards contains 52
Q61: The bar graph shows the expenditures of
Q62: Find the median. If necessary, round to
Q63: Find the median. If necessary, round to