Multiple Choice
The following pictograph shows the number of bicyclists who participated in the Labor Day weekend bicycle race for the
years 2003-2009. Use the graph to answer the question. 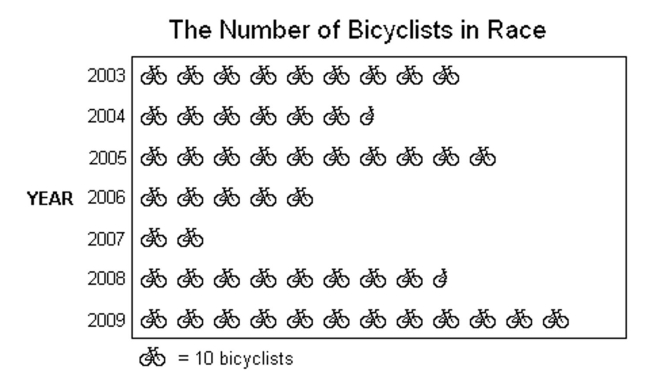
-In what years was there a decline in the number of cyclists who participated in the race?
A) 2004, 2006
B) 2004, 2006, 2007
C) 2004, 2006, 2007, 2008
D) 2005, 2008, 2009
Correct Answer:

Verified
Correct Answer:
Verified
Q52: Draw a tree diagram for the experiment
Q53: The circle graph summarizes the results of
Q54: Suppose that the numbers 1 through
Q55: Use the information given to draw
Q56: The line graph shows the recorded hourly
Q58: The circle graph summarizes the results of
Q59: A deck of cards contains 52
Q60: A deck of cards contains 52
Q61: The bar graph shows the expenditures of
Q62: Find the median. If necessary, round to