Multiple Choice
The line graph shows the recorded hourly temperatures in degrees Fahrenheit at an airport. 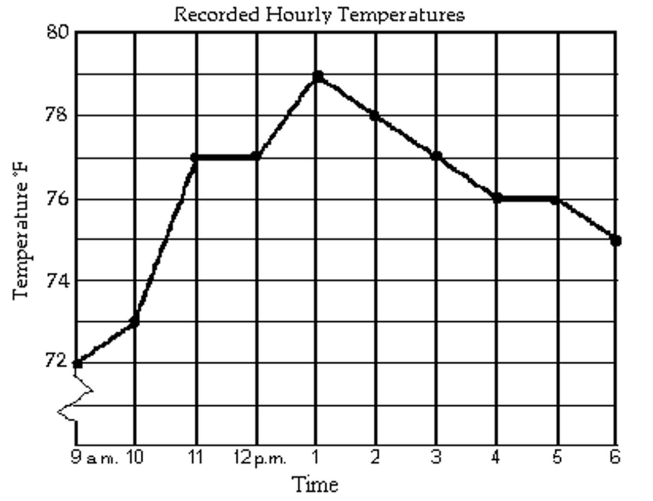
-During which hours was the temperature increasing?
A) 9 a.m. to 1 p.m.
B) 1 p.m. to 4 p.m. and 5 p.m. to 6 p.m.
C) 9 a.m. to 11 a.m. and 12 p.m. to 1 p.m.
D) 1 p.m. to 6 p.m.
Correct Answer:

Verified
Correct Answer:
Verified
Related Questions
Q51: Find the probability of the event
Q52: Draw a tree diagram for the experiment
Q53: The circle graph summarizes the results of
Q54: Suppose that the numbers 1 through
Q55: Use the information given to draw
Q57: The following pictograph shows the number of
Q58: The circle graph summarizes the results of
Q59: A deck of cards contains 52
Q60: A deck of cards contains 52
Q61: The bar graph shows the expenditures of