Multiple Choice
The circle graph summarizes the results of a survey of the favorite movie category chosen by a group of adults. 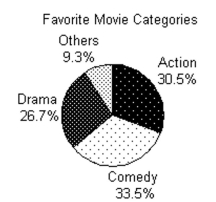
-1800 adults answer the survey. How many of the survey respondents said that they favor comedies? Round to the nearest whole.
A) 3350 respondents
B) 481 respondents
C) 603 respondents
D) 167 respondents
Correct Answer:

Verified
Correct Answer:
Verified
Q48: Find the mode or modes (if any).<br>-20,
Q49: Find the mean. If necessary, round to
Q50: Find the median. If necessary, round to
Q51: Find the probability of the event
Q52: Draw a tree diagram for the experiment
Q54: Suppose that the numbers 1 through
Q55: Use the information given to draw
Q56: The line graph shows the recorded hourly
Q57: The following pictograph shows the number of
Q58: The circle graph summarizes the results of