Multiple Choice
Draw a tree diagram for the experiment to find the number of outcomes.
-Spinning the spinner twice 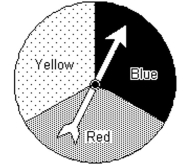
A) 9 outcomes
B) 27 outcomes
C) 6 outcomes
D) 3 outcomes
Correct Answer:

Verified
Correct Answer:
Verified
Related Questions
Q47: Find the mean. If necessary, round to
Q48: Find the mode or modes (if any).<br>-20,
Q49: Find the mean. If necessary, round to
Q50: Find the median. If necessary, round to
Q51: Find the probability of the event
Q53: The circle graph summarizes the results of
Q54: Suppose that the numbers 1 through
Q55: Use the information given to draw
Q56: The line graph shows the recorded hourly
Q57: The following pictograph shows the number of