Multiple Choice
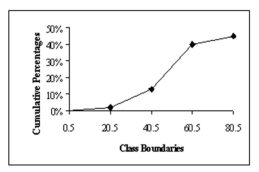 In the figure below, what class boundary has 30% of the data?
A) 0.5-20.5
B) 20.5-40.5
C) 40.5-60.5
D) 60.5-80.5
Correct Answer:

Verified
Correct Answer:
Verified
Related Questions
Q36: A Pareto chart does not have which
Q37: <img src="https://d2lvgg3v3hfg70.cloudfront.net/TB8376/.jpg" alt=" Construct a Pareto
Q37: A Pareto chart is useful for showing
Q38: Choose the correct statement describing the following
Q40: The following information shows the colours of
Q43: <img src="https://d2lvgg3v3hfg70.cloudfront.net/TB8376/.jpg" alt=" Find the class
Q45: A _ would most appropriately represent the
Q70: What are the boundaries of the class
Q73: What is the lower class limit in
Q76: A time series graph is useful for