Multiple Choice
Choose the correct statement describing the following stem and leaf plot for grades on a linear algebra exam. 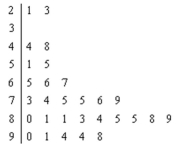
A) The range of the grades is between 23 and 98.
B) Of the 29 students who took the exam, nine scored between 80 and 89.
C) There are no gaps in the data.
D) The data is bimodal.
Correct Answer:

Verified
Correct Answer:
Verified
Q22: In order to graphically compare two frequency
Q36: A Pareto chart does not have which
Q37: <img src="https://d2lvgg3v3hfg70.cloudfront.net/TB8376/.jpg" alt=" Construct a Pareto
Q39: <img src="https://d2lvgg3v3hfg70.cloudfront.net/TB8376/.jpg" alt=" In the figure
Q40: The following information shows the colours of
Q43: <img src="https://d2lvgg3v3hfg70.cloudfront.net/TB8376/.jpg" alt=" Find the class
Q45: A _ would most appropriately represent the
Q70: What are the boundaries of the class
Q73: What is the lower class limit in
Q76: A time series graph is useful for