Essay
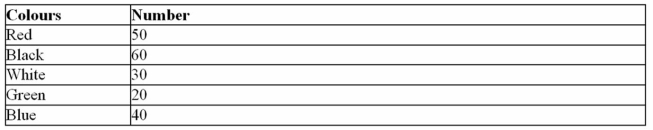
The following information shows the colours of cars preferred by customers.Draw
a pie graph and indicate how many degrees the black represents in a pie graph?
Correct Answer:

Verified
Correct Answer:
Verified
Q37: <img src="https://d2lvgg3v3hfg70.cloudfront.net/TB8376/.jpg" alt=" Construct a Pareto
Q37: A Pareto chart is useful for showing
Q38: Choose the correct statement describing the following
Q39: <img src="https://d2lvgg3v3hfg70.cloudfront.net/TB8376/.jpg" alt=" In the figure
Q43: <img src="https://d2lvgg3v3hfg70.cloudfront.net/TB8376/.jpg" alt=" Find the class
Q45: A _ would most appropriately represent the
Q45: Which of the following is a histogram?
Q70: What are the boundaries of the class
Q73: What is the lower class limit in
Q76: A time series graph is useful for