Short Answer
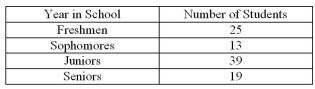 Construct a Pareto chart for the following distribution:
Correct Answer:

Verified
Sorted in the order ...View Answer
Unlock this answer now
Get Access to more Verified Answers free of charge
Correct Answer:
Verified
Sorted in the order ...
View Answer
Unlock this answer now
Get Access to more Verified Answers free of charge
Related Questions
Q22: In order to graphically compare two frequency
Q36: A Pareto chart does not have which
Q38: Choose the correct statement describing the following
Q39: <img src="https://d2lvgg3v3hfg70.cloudfront.net/TB8376/.jpg" alt=" In the figure
Q40: The following information shows the colours of
Q45: A _ would most appropriately represent the
Q57: For the class 10-18, the upper class
Q70: What are the boundaries of the class
Q73: What is the lower class limit in
Q76: A time series graph is useful for