Multiple Choice
 Refer to the diagrams, which pertain to a purely competitive firm producing output q and the industry in which it operates. Which of the following is correct?
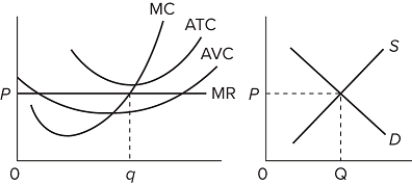
A) The diagrams portray neither long-run nor short-run equilibrium.
B) The diagrams portray both long-run and short-run equilibrium.
C) The diagrams portray short-run equilibrium but not long-run equilibrium.
D) The diagrams portray long-run equilibrium but not short-run equilibrium.
Correct Answer:

Verified
Correct Answer:
Verified
Q18: If the representative firm in a purely
Q19: If the price of bottled water is
Q20: <img src="https://d2lvgg3v3hfg70.cloudfront.net/TB8602/.jpg" alt=" If the competitive
Q21: When firms in a purely competitive industry
Q22: <img src="https://d2lvgg3v3hfg70.cloudfront.net/TB8602/.jpg" alt=" The graphs are
Q24: <img src="https://d2lvgg3v3hfg70.cloudfront.net/TB8602/.jpg" alt=" Line (2)in the
Q25: Suppose that an industry's long-run supply curve
Q26: <img src="https://d2lvgg3v3hfg70.cloudfront.net/TB8602/.jpg" alt=" The accompanying graph
Q27: Suppose an increase in product demand occurs
Q28: Purely competitive industry X has decreasing costs