Multiple Choice
 Line (2) in the diagram reflects a situation where resource prices
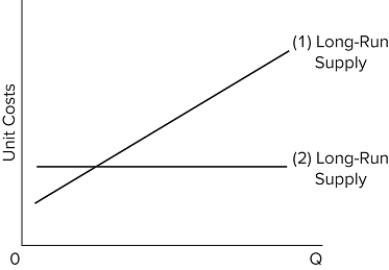
A) decline as industry output expands.
B) increase as industry output expands.
C) rise and then decline as industry output expands.
D) remain constant as industry output expands.
Correct Answer:

Verified
Correct Answer:
Verified
Q19: If the price of bottled water is
Q20: <img src="https://d2lvgg3v3hfg70.cloudfront.net/TB8602/.jpg" alt=" If the competitive
Q21: When firms in a purely competitive industry
Q22: <img src="https://d2lvgg3v3hfg70.cloudfront.net/TB8602/.jpg" alt=" The graphs are
Q23: <img src="https://d2lvgg3v3hfg70.cloudfront.net/TB8602/.jpg" alt=" Refer to the
Q25: Suppose that an industry's long-run supply curve
Q26: <img src="https://d2lvgg3v3hfg70.cloudfront.net/TB8602/.jpg" alt=" The accompanying graph
Q27: Suppose an increase in product demand occurs
Q28: Purely competitive industry X has decreasing costs
Q29: <img src="https://d2lvgg3v3hfg70.cloudfront.net/TB8602/.jpg" alt=" In the diagram,