Multiple Choice
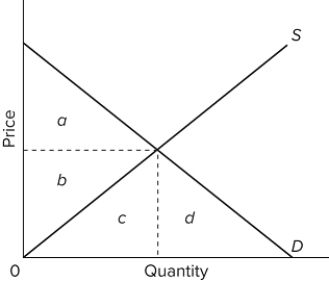 The accompanying graph represents the purely competitive market for a product. When the market is at equilibrium, the total opportunity cost of producing the equilibrium output level would be represented by the area
A) b + c.
B) b.
C) c.
D) a + b + c.
Correct Answer:

Verified
Correct Answer:
Verified
Q21: When firms in a purely competitive industry
Q22: <img src="https://d2lvgg3v3hfg70.cloudfront.net/TB8602/.jpg" alt=" The graphs are
Q23: <img src="https://d2lvgg3v3hfg70.cloudfront.net/TB8602/.jpg" alt=" Refer to the
Q24: <img src="https://d2lvgg3v3hfg70.cloudfront.net/TB8602/.jpg" alt=" Line (2)in the
Q25: Suppose that an industry's long-run supply curve
Q27: Suppose an increase in product demand occurs
Q28: Purely competitive industry X has decreasing costs
Q29: <img src="https://d2lvgg3v3hfg70.cloudfront.net/TB8602/.jpg" alt=" In the diagram,
Q30: The long-run supply curve would be upward
Q31: Balin's Burger Barn operates in a perfectly