Short Answer
You have moved to Chicago in the fall. The graph shows the average monthly high temperature for months since you moved to Chicago. A quadratic model for this data is  where y is the average monthly high temperature and x is months after you moved to Chicago. Use the model to predict the average monthly high temperature 2 months after you moved to Chicago.
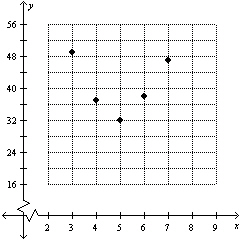
Correct Answer:

Verified
Correct Answer:
Verified
Q64: Given the data set draw a scatterplot.
Q65: The graph shows the average monthly high
Q66: The average profit in dollars A that
Q67: Given the data set draw a scatterplot.
Q68: The Supplemental Nutrition Assistance Program (SNAP) to
Q69: The Supplemental Nutrition Assistance Program (SNAP) to
Q70: The percentage P of 6 to 11
Q72: The profit in dollars A that your
Q73: The percentage P of 6 to 11
Q74: The graph shows the average monthly high