Multiple Choice
The graph shows the average monthly high temperature in Newark NJ for months from April to September. Does the graph follow a linear pattern quadratic pattern or neither? 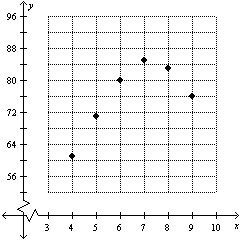
A) linear
B) quadratic
C) neither
Correct Answer:

Verified
Correct Answer:
Verified
Related Questions
Q64: Given the data set draw a scatterplot.
Q65: The graph shows the average monthly high
Q66: The average profit in dollars A that
Q67: Given the data set draw a scatterplot.
Q68: The Supplemental Nutrition Assistance Program (SNAP) to
Q69: The Supplemental Nutrition Assistance Program (SNAP) to
Q70: The percentage P of 6 to 11
Q71: You have moved to Chicago in the
Q72: The profit in dollars A that your
Q73: The percentage P of 6 to 11