Multiple Choice
Every month, the Gallup polling organization tracks various health issues in the United States using large national surveys. The following graph shows the estimated percent of American adults sick with a cold between June 2008 and January 2013.
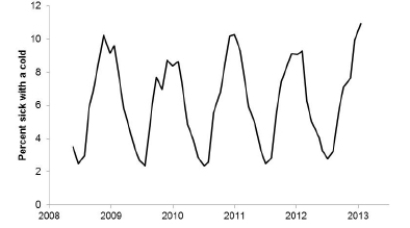
Which of the following statements about the data is TRUE?
A) There is a clear upward trend but no cyclical pattern.
B) There is a clear cyclical pattern but no trend.
C) There is a clear upward trend as well as a clear cyclical pattern.
D) There is neither a clear trend nor a cyclical pattern.
Correct Answer:

Verified
Correct Answer:
Verified
Q3: During winter, red foxes hunt small rodents
Q4: The estimated annual number of smoking-attributable
Q5: The following histogram shows body temperatures (in
Q6: Some variables that were recorded while studying
Q7: A sample of 55 streams in severe
Q9: Here are records of eye color
Q10: The EPA sends out a survey to
Q11: Every month, the Gallup polling organization tracks
Q12: For a biology lab course containing
Q13: The following histogram shows the yearly number