Multiple Choice
The following histogram shows body temperatures (in degrees Fahrenheit) for 65 healthy adult women.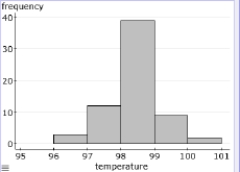 What is the best description of this distribution?
A) Roughly symmetric
B) Bimodal
C) Clearly right-skewed
D) Clearly left-skewed
Correct Answer:

Verified
Correct Answer:
Verified
Related Questions
Q1: The following histogram shows body temperatures (in
Q2: The following time plot gives the number
Q3: During winter, red foxes hunt small rodents
Q4: The estimated annual number of smoking-attributable
Q6: Some variables that were recorded while studying
Q7: A sample of 55 streams in severe
Q8: Every month, the Gallup polling organization tracks
Q9: Here are records of eye color
Q10: The EPA sends out a survey to
Q11: Every month, the Gallup polling organization tracks