Multiple Choice
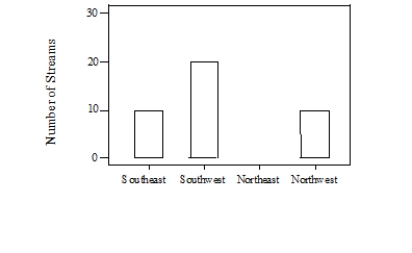
A sample of 55 streams in severe distress was obtained during 2007. The following bar graph illustrates the number of streams that are from the Northeast, Northwest, Southeast, or Southwest. In the bar graph, the bar for the Northeast has been omitted.
Which of the following statements is correct about these data?
A) A time plot of the 2007 distribution would be more informative.
B) The bar graph is skewed to the right.
C) The bar graph is skewed to the left.
D) It would be correct to make a pie chart if you included the Northeast category.
Correct Answer:

Verified
Correct Answer:
Verified
Q2: The following time plot gives the number
Q3: During winter, red foxes hunt small rodents
Q4: The estimated annual number of smoking-attributable
Q5: The following histogram shows body temperatures (in
Q6: Some variables that were recorded while studying
Q8: Every month, the Gallup polling organization tracks
Q9: Here are records of eye color
Q10: The EPA sends out a survey to
Q11: Every month, the Gallup polling organization tracks
Q12: For a biology lab course containing