Essay
The following figure shows the demand curve faced by a monopolist.
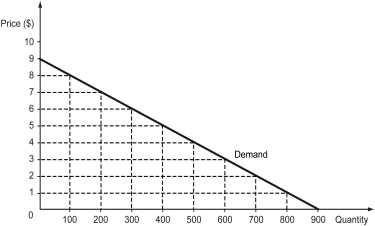
a)Calculate the quantity effect and price effect of a price cut from $6 to $5.Estimate the change in total revenue due to the price cut.
b)Comment on the elasticity of the demand curve between the price range $5 to $6.
Correct Answer:

Verified
a) When a monopolist cuts the price of i...View Answer
Unlock this answer now
Get Access to more Verified Answers free of charge
Correct Answer:
Verified
View Answer
Unlock this answer now
Get Access to more Verified Answers free of charge
Q162: The following figure shows the demand curve
Q163: Why does the economy of scale lead
Q164: A musician was guaranteed by the government
Q165: The following figure shows the market demand
Q166: The following figure shows the costs and
Q168: The following table shows the quantities sold
Q169: The following figure shows the graph of
Q170: The following figure is a supply-demand diagram
Q171: The pricing rule for a monopolist who
Q172: Average total cost decreases with an increase