Multiple Choice
The following figure shows the graph of a monopoly market. The marginal revenue curve has been omitted.
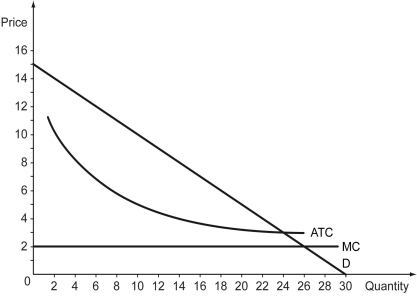
-Refer to the figure above.How much would this monopolist charge for its product?
A) $2
B) $3
C) $5
D) $10
Correct Answer:

Verified
Correct Answer:
Verified
Related Questions
Q164: A musician was guaranteed by the government
Q165: The following figure shows the market demand
Q166: The following figure shows the costs and
Q167: The following figure shows the demand curve
Q168: The following table shows the quantities sold
Q170: The following figure is a supply-demand diagram
Q171: The pricing rule for a monopolist who
Q172: Average total cost decreases with an increase
Q173: The policy that aims to regulate and
Q174: Which of the following is a current