Essay
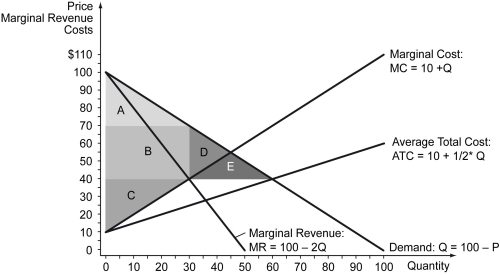
The following figure is a supply-demand diagram that characterizes the demand, marginal revenue, and cost curves for a profit-maximizing monopolist.
-The following figure shows the demand curve for Good X in a perfectly competitive market.Later,the government grants one of the firms the exclusive right to manufacture and sell Good X.MR represents the marginal revenue curve of the firm when it operates as a monopoly.The marginal cost of producing Good X is constant at $5.
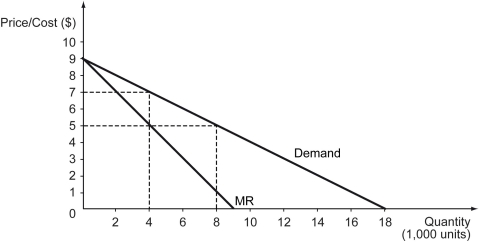
a)What is the quantity supplied when the market is perfectly competitive? What happens to the quantity supplied once the market changes to a monopoly?
b)What is the market price when the market is perfectly competitive? What is the market price when the market changes to a monopoly?
c)Compare the consumer surplus when the market is perfectly competitive and the consumer surplus when the market is a monopoly.Is there any producer surplus or deadweight loss in either case? If yes,then how much?
Correct Answer:

Verified
a)A perfectly competitive firm equates p...View Answer
Unlock this answer now
Get Access to more Verified Answers free of charge
Correct Answer:
Verified
View Answer
Unlock this answer now
Get Access to more Verified Answers free of charge
Q165: The following figure shows the market demand
Q166: The following figure shows the costs and
Q167: The following figure shows the demand curve
Q168: The following table shows the quantities sold
Q169: The following figure shows the graph of
Q171: The pricing rule for a monopolist who
Q172: Average total cost decreases with an increase
Q173: The policy that aims to regulate and
Q174: Which of the following is a current
Q175: Which of the following statements is true