Multiple Choice
Which one of the following graphs best represents the relationship between the concentration of reactants and products with respect to time for the following chemical reaction?
2 NO2(g)  2 NO(g) + O2(g)
A) 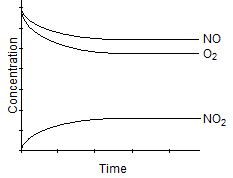
B) 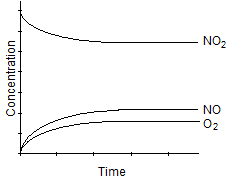
C) 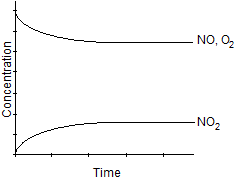
D) 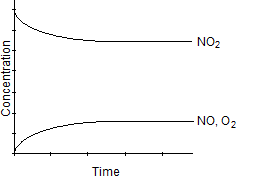
E) 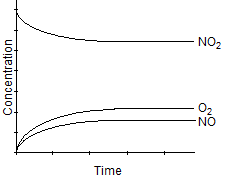
Correct Answer:

Verified
Correct Answer:
Verified
Q46: What would be the effect of decreasing
Q47: Assume that the reaction quotient, Q<sub>c</sub>, for
Q48: What is the K<sub>sp</sub> of PbBr<sub>2</sub> if
Q49: What would happen if O<sub>2</sub> were removed
Q50: Of the compounds in the table
Q52: Approximately how many grams of Ag<sub>2</sub>CO<sub>3</sub> will
Q53: Ag<sub>2</sub>SO<sub>4</sub>(s) is in equilibrium with silver and
Q54: If a solution has a Mg<sup>2+</sup> ion
Q55: <br> <img src="https://d2lvgg3v3hfg70.cloudfront.net/TB9692/.jpg" alt="
Q56: Which of the following equilibria would not