Essay
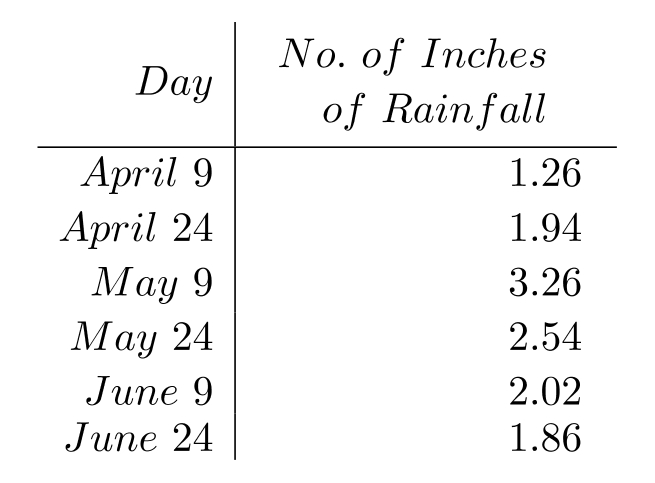
Construct a bar graph to represent the given data.
-The following table shows the number of inches of rainfall measured at City during the following days.
Correct Answer:

Verified
Answers may vary. Th...View Answer
Unlock this answer now
Get Access to more Verified Answers free of charge
Correct Answer:
Verified
Answers may vary. Th...
View Answer
Unlock this answer now
Get Access to more Verified Answers free of charge
Related Questions
Q74: Twenty teenagers were asked to give their
Q75: Find the median for the set
Q76: Solve the problem.<br>-Jeremy's car got 240
Q77: A dart is thrown randomly and
Q78: Solve the problem.<br>-Draw a tree diagram for
Q80: Find the mean.<br>- <span class="ql-formula" data-value="\$
Q81: Use the pictograph to answer the question.<br>-For
Q82: Make a line graph of the data
Q83: Use the pictograph to answer the question.<br>-For
Q84: Solve the problem.<br>-An experiment is done to