Multiple Choice
Use the pictograph to answer the question.
-For selected countries, this pictograph shows approximately how many kilograms of seafood are consumed by each person (per capita) annually.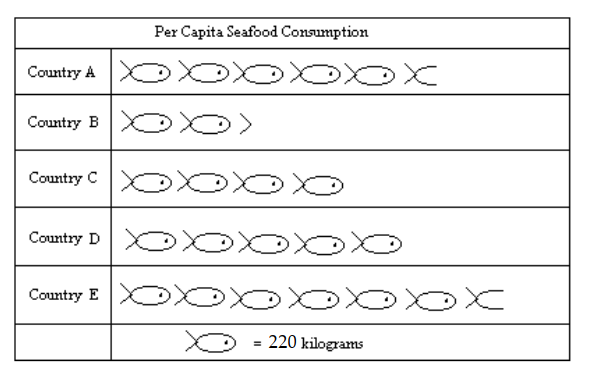
Approximately how many more kilograms of seafood is eaten per person in Country A than in Country B?
A) 660 kilograms
B) 715 kilograms
C) 770 kilograms
D) 550 kilograms
Correct Answer:

Verified
Correct Answer:
Verified
Q76: Solve the problem.<br>-Jeremy's car got 240
Q77: A dart is thrown randomly and
Q78: Solve the problem.<br>-Draw a tree diagram for
Q79: Construct a bar graph to represent
Q80: Find the mean.<br>- <span class="ql-formula" data-value="\$
Q82: Make a line graph of the data
Q83: Use the pictograph to answer the question.<br>-For
Q84: Solve the problem.<br>-An experiment is done to
Q85: Use the graph to answer the question.<br>
Q86: The bar graph below shows the number