Essay
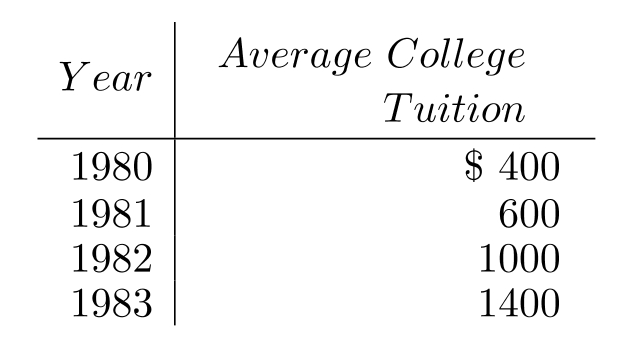
Make a line graph of the data in the table.
-The following table shows the average tuition for one semester at City X College over various years. Use time on the horizontal scale for your line graph.
Correct Answer:

Verified
Answers ma...View Answer
Unlock this answer now
Get Access to more Verified Answers free of charge
Correct Answer:
Verified
View Answer
Unlock this answer now
Get Access to more Verified Answers free of charge
Q77: A dart is thrown randomly and
Q78: Solve the problem.<br>-Draw a tree diagram for
Q79: Construct a bar graph to represent
Q80: Find the mean.<br>- <span class="ql-formula" data-value="\$
Q81: Use the pictograph to answer the question.<br>-For
Q83: Use the pictograph to answer the question.<br>-For
Q84: Solve the problem.<br>-An experiment is done to
Q85: Use the graph to answer the question.<br>
Q86: The bar graph below shows the number
Q87: Obtain the five-number summary for the