Multiple Choice
Use the pictograph to answer the question.
-For selected countries, this pictograph shows approximately how many kilograms of seafood are consumed by each person (per capita) annually.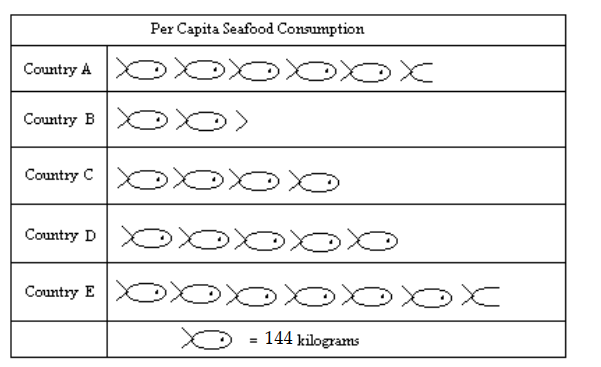
What is the approximate seafood consumption in Country E?
A) 900 kilograms
B) 972 kilograms
C) 864 kilograms
D) 1008 kilograms
Correct Answer:

Verified
Correct Answer:
Verified
Q78: Solve the problem.<br>-Draw a tree diagram for
Q79: Construct a bar graph to represent
Q80: Find the mean.<br>- <span class="ql-formula" data-value="\$
Q81: Use the pictograph to answer the question.<br>-For
Q82: Make a line graph of the data
Q84: Solve the problem.<br>-An experiment is done to
Q85: Use the graph to answer the question.<br>
Q86: The bar graph below shows the number
Q87: Obtain the five-number summary for the
Q88: Construct a frequency distribution for the