Multiple Choice
Use the graph to answer the question.
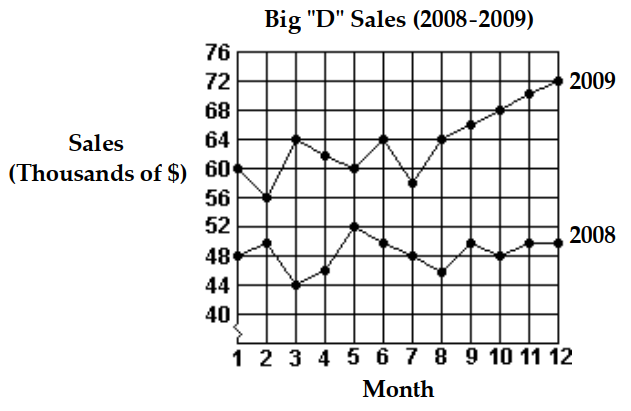
-Which month in 2009 had the highest sales?
A) Month 3
B) Month 6
C) Month 12
D) Month 5
Correct Answer:

Verified
Correct Answer:
Verified
Related Questions
Q80: Find the mean.<br>- <span class="ql-formula" data-value="\$
Q81: Use the pictograph to answer the question.<br>-For
Q82: Make a line graph of the data
Q83: Use the pictograph to answer the question.<br>-For
Q84: Solve the problem.<br>-An experiment is done to
Q86: The bar graph below shows the number
Q87: Obtain the five-number summary for the
Q88: Construct a frequency distribution for the
Q89: Given the grades of a student
Q90: Find any modes that exist.<br>-104, 141, 156,