Multiple Choice
Figure 52.12 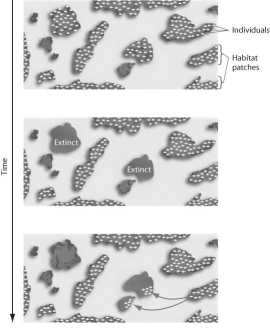
-The figure above represents the dynamics of
A) metapopulations.
B) extinction.
C) emigration.
D) both metapopulations and extinction.
E) both extinction and emigration.
Correct Answer:

Verified
Correct Answer:
Verified
Q7: It is estimated that a flock of
Q8: Figure 52.7 <img src="https://d2lvgg3v3hfg70.cloudfront.net/TB3733/.jpg" alt="Figure 52.7
Q10: Which of these terms defines how the
Q13: Use the following abstract from Theoretical Population
Q13: Figure 52.14 <img src="https://d2lvgg3v3hfg70.cloudfront.net/TB3733/.jpg" alt="Figure 52.14
Q15: Figure 52.15 <img src="https://d2lvgg3v3hfg70.cloudfront.net/TB3733/.jpg" alt="Figure 52.15
Q16: Figure 52.3 <img src="https://d2lvgg3v3hfg70.cloudfront.net/TB3733/.jpg" alt="Figure 52.3
Q17: During the Lacerta vivipara lizard study,researchers monitored
Q17: Figure 52.9 <img src="https://d2lvgg3v3hfg70.cloudfront.net/TB3733/.jpg" alt="Figure 52.9
Q24: <span class="ql-formula" data-value="\text {Life Table for Lacerta